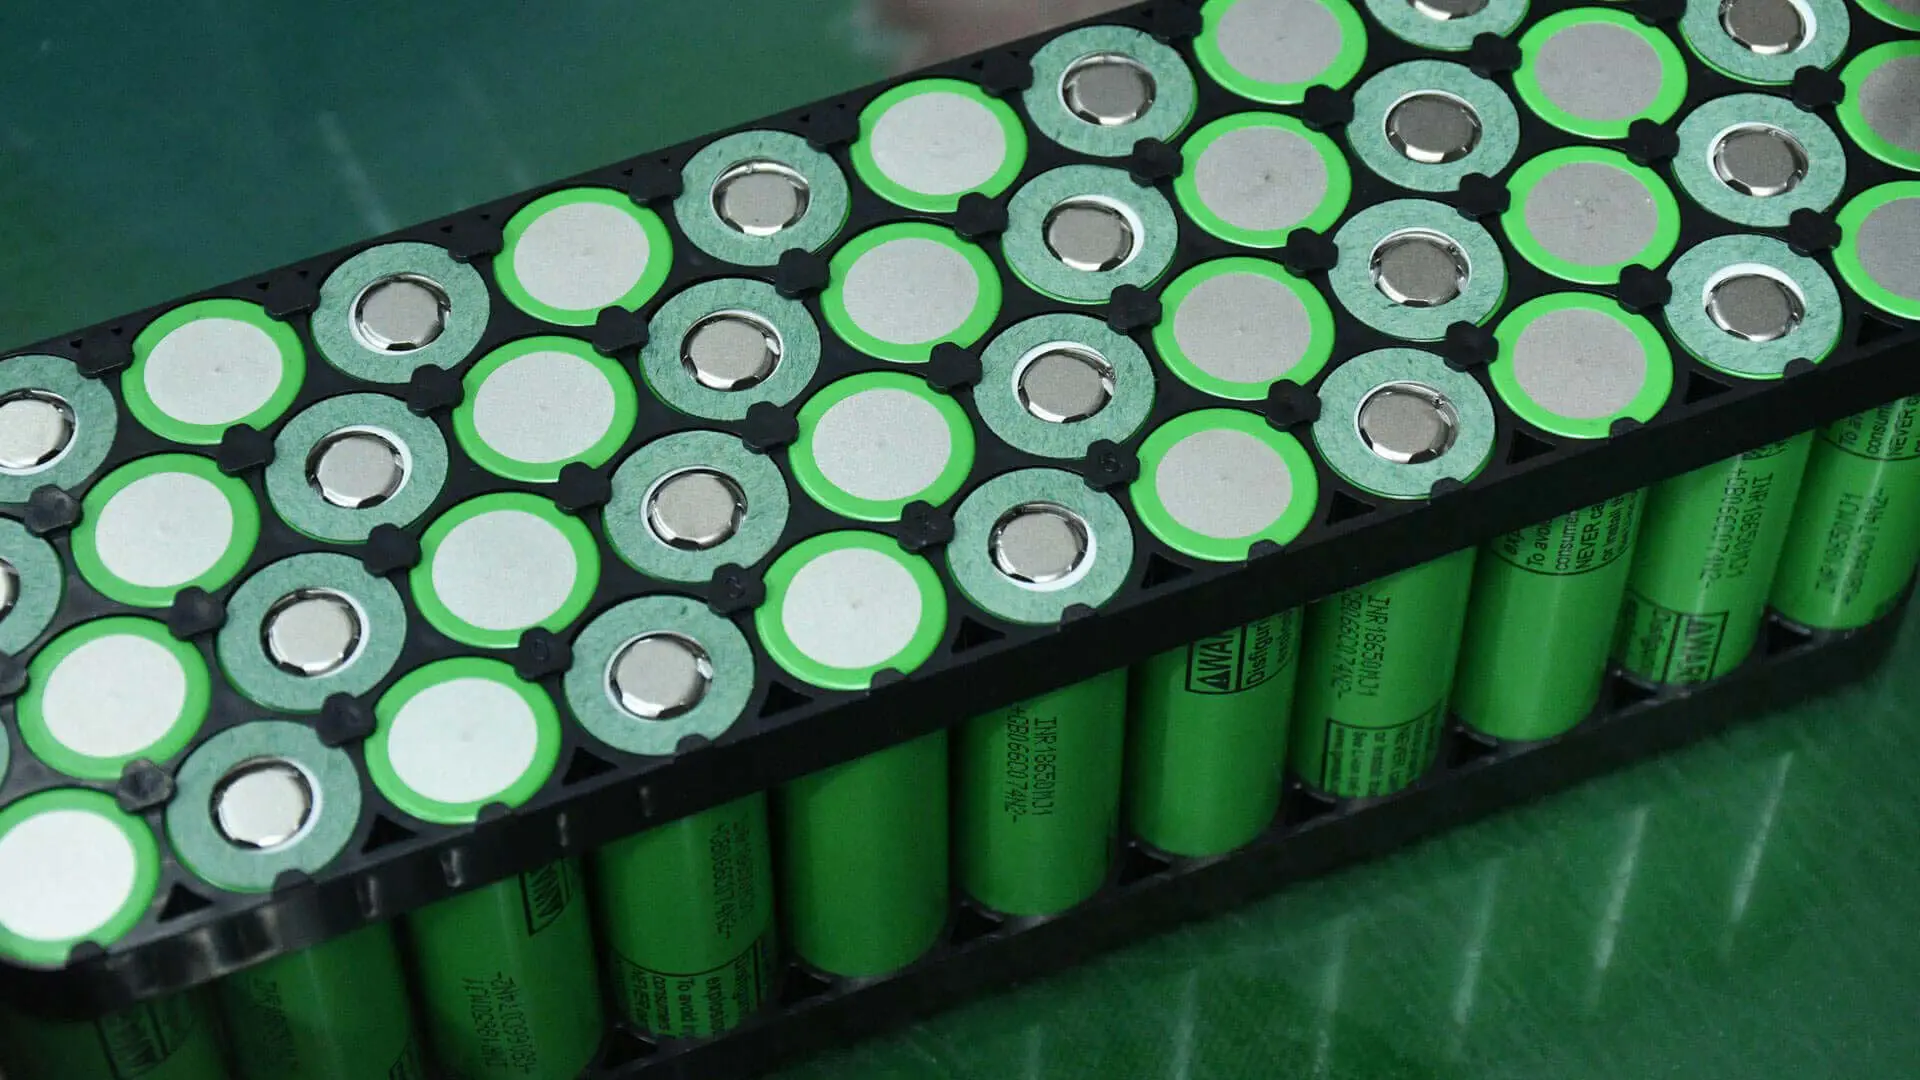
Twenty years in this Lithium battery pack industry, and I still get asked about the lithium-ion battery self-discharge rate more often than I get asked about it correctly. “What’s your self-discharge rate” is a common question. “At what temperature, what SoC, over what duration” almost never comes next. Skip those three conditions and the percentage that follows isn’t a spec — it’s closer to a marketing line. This article is about what sits behind that number: how self-discharge actually happens, how a factory screens for it, and what a buyer should be asking a supplier instead.
Key Takeaways
- Under ambient storage, lithium-ion self-discharge sits roughly in the 1–5% per month range across research labs, consumer battery brands, and industry publications. The spread exists because chemistry, temperature, SoC, and cell age each move the number independently.
- Temperature matters most, and it follows Arrhenius kinetics — near room temperature, reaction rates roughly double for every 10°C rise.
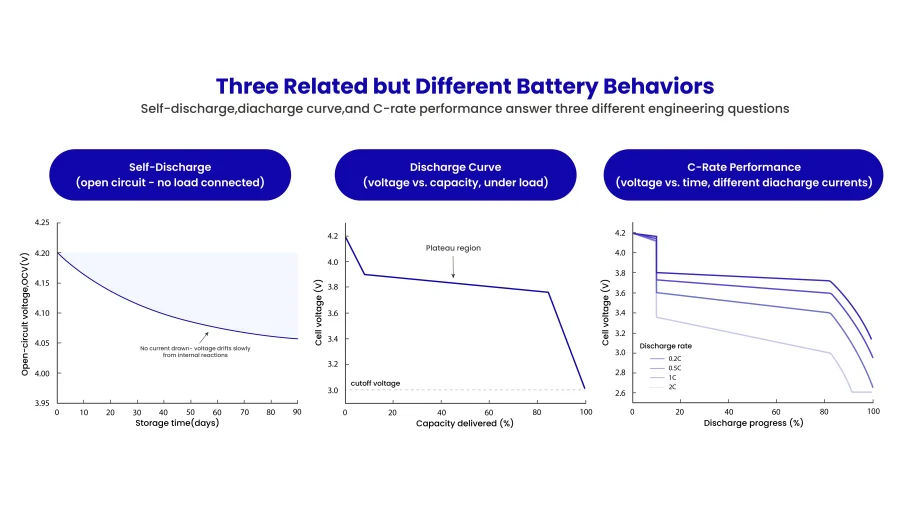
- Self-discharge rate, discharge rate (C-rate), and a discharge curve are three separate specs. Search results and datasheets blur them constantly.
- Self-discharge is also a manufacturing quality-control signal, not just a chemistry property — and that’s the direction supplier evaluation should go, rather than a chemistry popularity contest.
What Is the Self-Discharge Rate of a Lithium-Ion Battery?
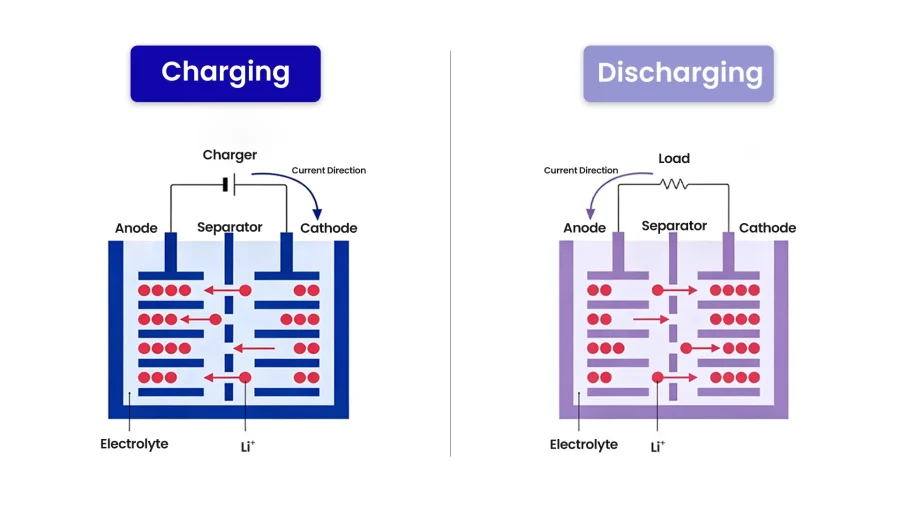
A battery sitting on a shelf, disconnected from anything, still loses charge over time. That’s self-discharge. The self-discharge rate is the percentage of stored capacity a cell loses per month or per year of open-circuit storage. It isn’t a defect — every rechargeable chemistry does it, driven by internal reactions that consume active lithium or a small leakage current that flows even with no external load. Because a cell’s state of charge tracks its open-circuit voltage (OCV), self-discharge shows up as a slow OCV decline. Usually expressed as a percentage of capacity lost per month, or per year of open-circuit storage.
Is Self-Discharge Rate the Same as Discharge Rate (C-Rate)?
No, and this is the mix-up I see most often in this keyword space. C-rate describes how fast a battery discharges under load — 1C empties a full cell in about an hour — and it’s tied to your application’s current draw, with its own set of trade-offs around internal resistance, heat, and electrode structure. Self-discharge describes charge loss with no load at all: a storage spec, not a performance one. A cell can have strong high-rate discharge capability and mediocre self-discharge, or the reverse. The two just don’t track each other. If you searched “high discharge lithium ion battery” or “max discharge current li-ion battery,” you actually wanted C-rate performance — we cover the engineering trade-offs there in the role of c-rating in lithium-ion battery pack design.
What’s the Difference Between Self-Discharge Rate and a Discharge Curve?
A discharge curve plots voltage against delivered capacity (or time) while the cell is under load — it tells you how much voltage sags as you draw the battery down, which is what you need for setting cutoff voltages and estimating runtime. Self-discharge is measured with the circuit open: no current flowing, just OCV drift or capacity retention after a rest period. Different test setups, different questions. If an article shows you one and labels it the other, that’s worth a second look.
Do Lithium-Ion Batteries Self-Discharge When Not in Use?
Yes, unavoidably. A cell sitting fully disconnected on a shelf at room temperature, in good condition, still loses some charge through internal chemistry over time. The only variable is how fast.
Typical Self-Discharge Rates by Lithium-Ion Chemistry
The table below cross-checks figures from a research-instrument manufacturer, a consumer battery brand, and industry publications, rather than repeating the one number everyone else copies from Wikipedia.
| Chemistry | Typical self-discharge (ambient storage) | Source pattern |
| Lithium-ion (general, NMC/NCA/LCO) | ~1–5% per month | Research-lab sources (EL-CELL) and consumer brands (EcoFlow cites ~2–3%/month for standard Li-ion) land in roughly the same place |
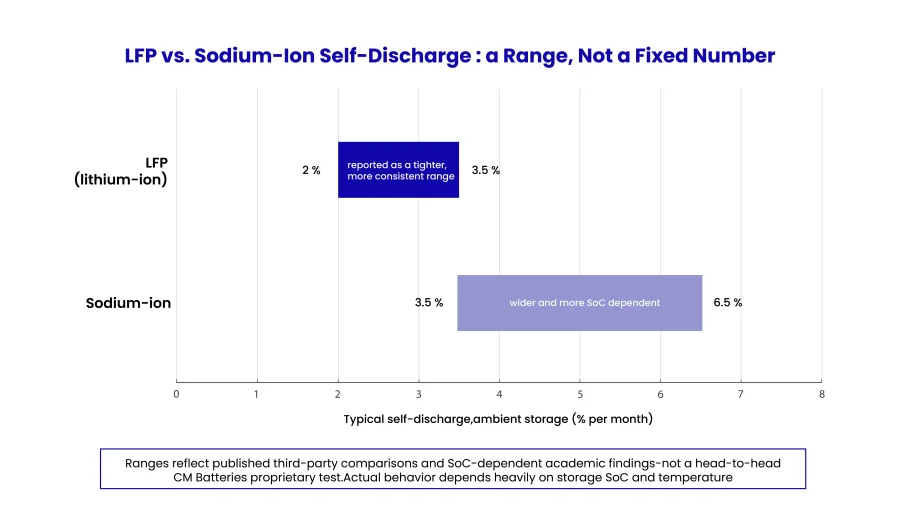
| LiFePO4 (LFP) | Generally at the low end, often cited near or under 3%/month | Multiple independent sources describe LFP as among the lowest-self-discharge rechargeable chemistries |
| Sodium-ion | Chemistry-dependent and SoC-sensitive — see below | Don’t assume Li-ion figures carry over |
| NiMH (for reference) | ~10–15% loss in the first 24 hours, then roughly 20–30% per month for standard cells; low-self-discharge (LSD) variants use a thicker separator to hold monthly losses to a small single-digit percentage | Included for contrast only — NiMH’s self-discharge mechanism (metal hydride reactivity) is chemically unrelated to lithium-ion’s, so benchmarking the two against each other doesn’t tell you much |
There’s usually a gap between what a supplier claims and what you can actually check. “Self-discharge < 3%/month” only means something once it’s tied to a storage temperature, an SoC, and a test duration. Without those three, the number can’t be independently verified — treat it as marketing copy whether it’s on a competitor’s datasheet or ours.
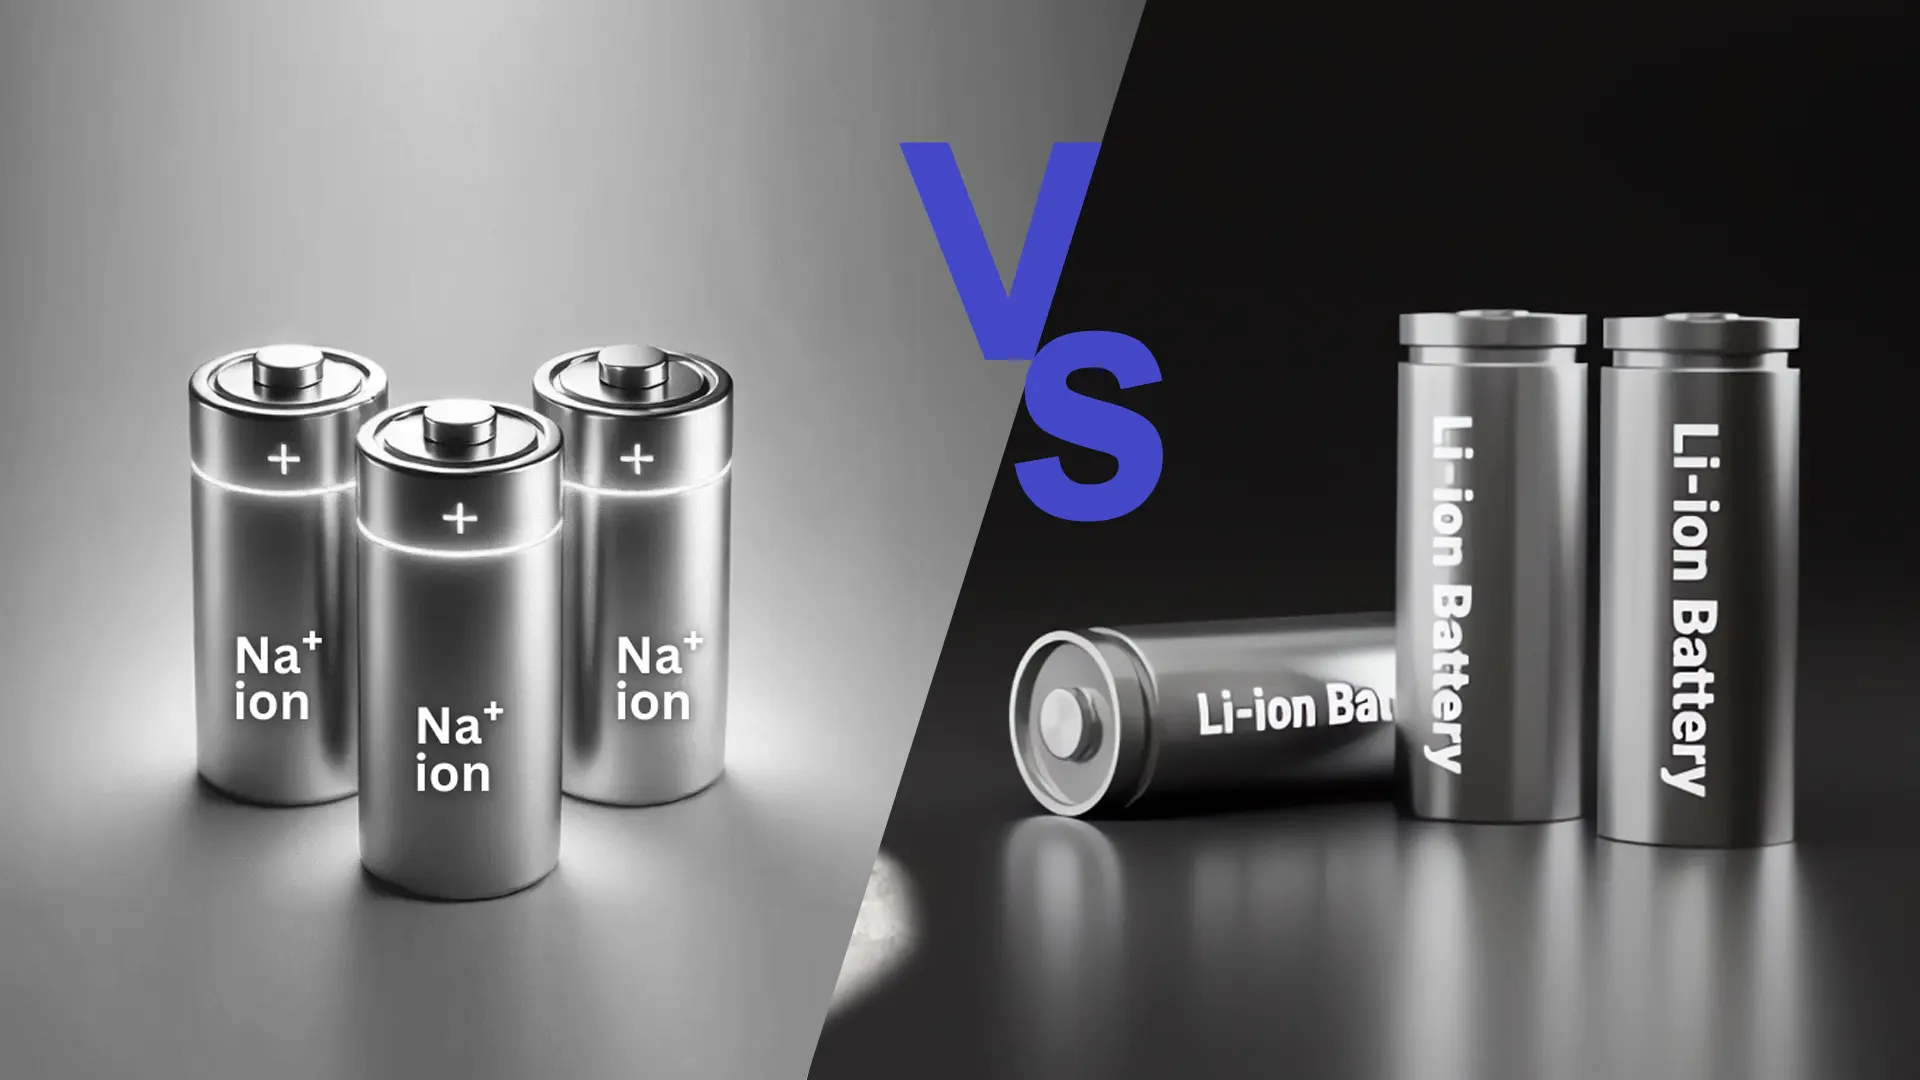
Sodium-Ion vs. Lithium-Ion: How Do They Compare on Self-Discharge?
Sodium-ion keeps coming up as a lithium-ion alternative, so this deserves a direct answer rather than an assumption.
Industry commentary generally puts sodium-ion self-discharge above LFP’s — one recent comparison cited LFP around 3% with sodium-ion running higher, enough that efficiency can visibly suffer when a sodium-ion system sits idle for a while.
Peer-reviewed calendar-aging research complicates that a bit: a study comparing Li-ion and Na-ion cells found that at high states of charge, an NMC-type lithium cell and an NFM-type sodium cell showed self-discharge dominated by similar cathode-side reactions — while an LFP cell held at 70% SoC actually lost the most capacity among the SoC points tested.
So it’s less “one chemistry wins outright” and more that both families are SoC-dependent, and a single percentage deserves the same scrutiny either way.
On our end: CM Batteries’ proprietary sodium-ion bench data so far covers low-temperature discharge — three tests down to −40°C, published in our sodium-ion vs. LiFePO4 cold-climate comparison.
We haven’t run our own long-term sodium-ion self-discharge tracking yet, and I’d rather say that outright than blur the two data sets together. If your application involves both cold-climate operation and extended idle storage, those are two separate questions — worth asking a supplier about each on its own.
What Drives Self-Discharge
Temperature
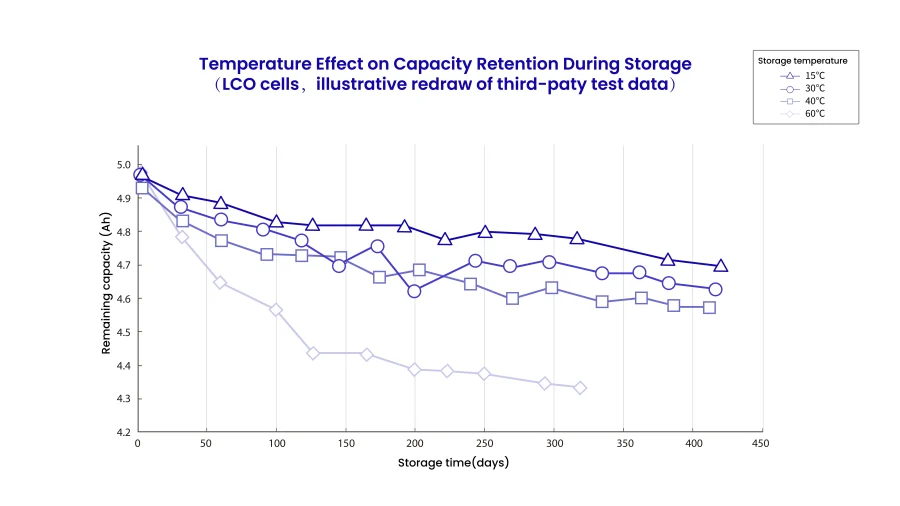
Temperature’s effect on self-discharge is strong, direct, and roughly exponential — higher storage temperature speeds up the parasitic reactions behind capacity loss, cooler storage slows them down. This tracks Arrhenius-type kinetics, and it’s part of why low-temperature storage is standard practice in calendar-aging studies.
One illustrative example, drawn from third-party published aging data (not our own test — attribution below), tracked LCO cells at several fixed temperatures over hundreds of days. The cells stored hotter lost capacity noticeably faster than the ones kept near room temperature or below. LCO isn’t part of our product line, but the temperature pattern it shows lines up with the mechanisms below, which hold across lithium-ion chemistries generally.
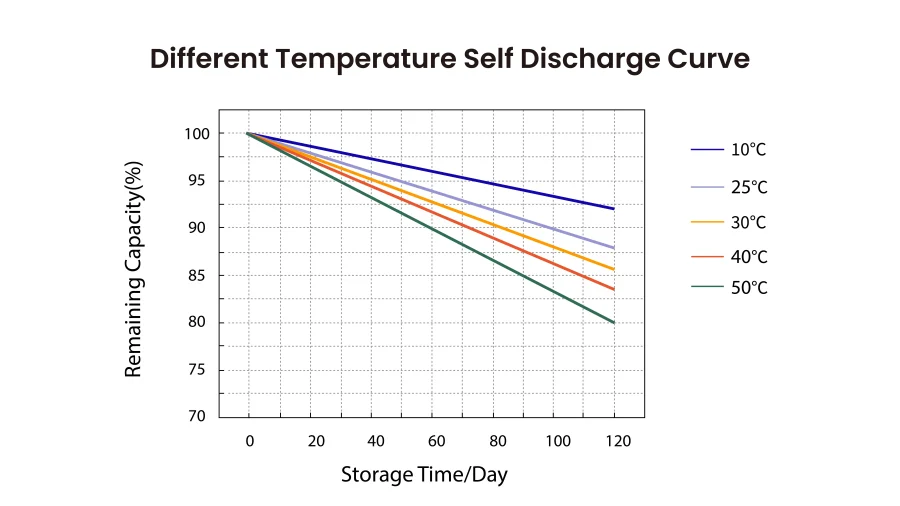
One production example we’ve seen in industry testing fits temperature and storage duration into a simple additive relationship — for one specific cell design, something like self-discharge (mV) ≈ 0.23 × storage days + 0.39 × (storage temperature − 25°C). Worth being clear about this: those coefficients belong to one specific cell chemistry and construction, and don’t transfer to a different cell. It’s here as a concrete illustration of how temperature and time combine, not a formula to reuse.
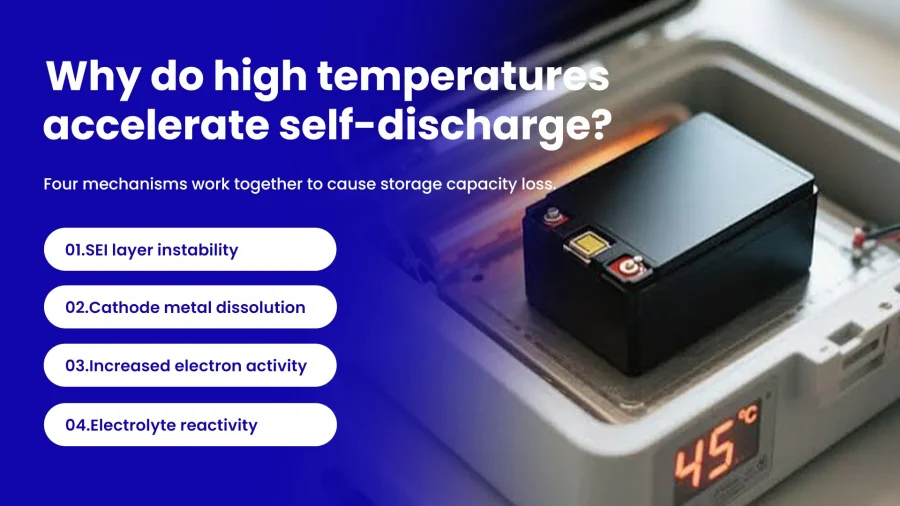
Four mechanisms combine at elevated temperature to speed up capacity loss during storage:
| Mechanism | Why it happens | Result |
| SEI layer instability | Higher temperatures destabilize the solid electrolyte interphase (SEI) on the anode, and it breaks down | The cell rebuilds the SEI, consuming active lithium that’s permanently gone from cyclable capacity |
| Cathode metal dissolution | Heat speeds up dissolution of transition metals from the cathode structure | Loss of active cathode material, higher impedance |
| Increased electron activity | More thermal energy makes electrons more mobile and reactive | More side reactions at the anode/electrolyte interface |
| Electrolyte reactivity | Heat raises the electrolyte’s chemical activity | More reaction between electrolyte and electrode surfaces |
Storage State of Charge (SoC)
The SoC a cell is stored at matters too — higher SoC generally means faster capacity fade in storage, because a fully charged cathode/anode pair sits at a higher electrochemical potential that pushes more side reactions along. It’s why partial-charge storage (commonly cited around 40–60%) is the standard recommendation for anything sitting long-term, rather than storing at 100%.
Cell-to-Cell Manufacturing Consistency
This is where self-discharge stops being purely a chemistry question and becomes a manufacturing one — and it’s the part most articles on this topic skip entirely. Contamination picked up during electrode coating or cell assembly, dimensional deviation or processing burrs on the current collector, separator defects — any of these can create abnormal internal leakage or micro-short paths that show up as elevated or inconsistent self-discharge readings within a batch.
Academic work on pack consistency treats self-discharge rate as one of the core indicators, alongside SoC, capacity, and internal resistance, used to judge whether a batch of cells is consistent enough to pack together safely.
The practical effect gets described with a fairly simple analogy on production floors: pack capacity behaves like a barrel made of staves of different heights — what the pack can actually deliver is set by its weakest cell, not the average or the best performer.
A handful of cells with abnormal self-discharge in an otherwise decent batch can quietly cap the whole pack’s performance, and the imbalance tends to widen over time as unevenly-drained cells age at different rates.
Physical vs. chemical self-discharge: different problems, different fixes
An elevated self-discharge reading in a batch usually traces back to one of two distinct root causes, and engineers treat them differently.
Physical Self-Discharge: Internal Leakage
Physical self-discharge is internal leakage, plain and simple — metal particulate piercing the separator, a separator defect, an electrode burr bridging to the opposite electrode, creating a path electrons can take directly. This tends to track batch, incoming material, and process variation, and in principle it’s addressable through incoming inspection and tighter process control.
Chemical Self-Discharge: Side Reactions
Chemical self-discharge is the side reactions that happen between electrode and electrolyte anyway, consuming active lithium in the process — SEI rebuilding, electrode corrosion from the electrolyte, that kind of thing. This is more a property of the formulation and material system itself, not a batch that “went wrong.”
How to Tell Them Apart
Telling the two apart usually comes down to a handful of practical tests:
- High-temperature vs. room-temperature ratio test. Physical short-circuit leakage doesn’t care much about temperature; chemical side reactions speed up noticeably with heat. Store cells for a fixed duration at each temperature and compare the self-discharge ratio between the two — a ratio near a reference benchmark points to physical causes dominating, while a ratio well below that benchmark points to chemical side reactions dominating. The exact benchmark ratio and durations are chemistry-specific, not a universal constant, but the comparison method itself is genuinely useful.
- Before-and-after-cycling comparison. Charge/discharge cycling tends to “burn through” or fuse internal micro-short points, so physical self-discharge usually drops noticeably after cycling. If self-discharge barely changes before and after cycling, chemical causes are more likely dominant.
- Leakage current testing at cryogenic temperature. Testing in liquid nitrogen essentially freezes out electrochemical side reactions, so whatever leakage current shows up is largely attributable to physical short-circuit paths.
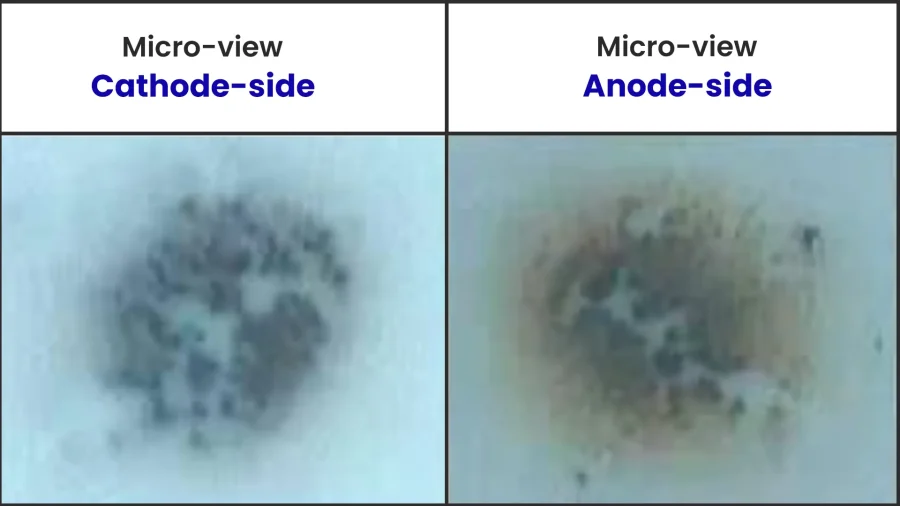
- Disassembling a failed cell and examining the number, shape, and composition of dark spots on the separator is one of the more direct failure-analysis techniques for identifying physical self-discharge sources like metal contamination.
- Sensitivity across different SoC. Cells with abnormal physical self-discharge are usually easier to spot at high SoC than at low SoC, because the larger potential difference makes micro-short leakage current more visible.
Why the Distinction Matters
The value of this distinction is practical: a single self-discharge percentage tells you whether a batch has a problem. Separating physical from chemical causes tells you where the problem sits — supply-chain and process control versus formulation and material design — which matters a great deal when you’re deciding whether tighter incoming inspection will actually fix it. It’s also a good question to bring to a supplier directly: when an abnormal batch turns up, how do they trace the root cause?
How Self-Discharge Is Actually Test and Measured
The most direct method — fully charge a cell, measure capacity, let it rest disconnected for a known period, discharge and measure again — is accurate but slow and expensive, because a meaningful signal at typical Li-ion rates can take weeks to show up. That’s not something you can run on every cell coming off a line. In practice, production and R&D lean on a handful of methods, each with its own trade-offs:
Six Ways to Measure Self-Discharge
- Voltage-drop method — tracks the rate of open-circuit voltage change before and after storage. Simplest to run and the most common method on production lines, though the voltage drop needs to be converted through the cell’s voltage-SoC characteristic to relate to actual capacity loss.
- Capacity-fade method — measures the percentage capacity loss per unit time directly. Closer to a “true” measurement of loss, but slow and costly, so it’s more common in validation testing than batch screening.
- Self-discharge current method — back-calculates an equivalent self-discharge current (Isd) from the relationship between capacity loss and storage duration, useful for comparing across different storage conditions.
- Lithium-consumption modeling — builds a model of how much active lithium side reactions consume over storage time, based on how the anode SEI’s electronic conductivity affects lithium consumption rate. More of a mechanism-research tool than a production one.
- K-value (or equivalent) screening — a formula combining voltage drop, temperature, and storage time into a single score; effectively the production-engineered version of the voltage-drop method, used to flag cells with abnormally high inferred leakage so they can be pulled before they reach a pack.
- Electrochemical impedance spectroscopy (EIS) — mostly for deeper diagnostic or R&D work, useful for inferring what’s driving a self-discharge reading rather than just reporting the number.
None of these is inherently “more correct” than the others. They trade off speed, cost, and precision differently, which is exactly why the method matters as much as the resulting figure.
What Decides Whether the Measurement Is Trustworthy
Choosing the right method is only the first step — the measurement system itself has a few details that matter just as much, and most articles on this topic never mention them:
- SoC selection isn’t arbitrary. dOCV/dT — how sensitive open-circuit voltage is to temperature — gets significantly amplified on a cell’s voltage plateau, so a small temperature fluctuation can get misread as a large SoC difference, introducing real error. Production self-discharge tests typically pick an SoC point that’s relatively insensitive to temperature swings; the exact point varies by cell design, and a full-charge state is also a simple, practical choice some lines use.
- Test start time matters. Right after charging, a cell’s internal polarization hasn’t settled yet, and measuring voltage change rate too early introduces bias. In practice, testing typically waits until the voltage change rate stabilizes before the clock starts — how long that takes varies by cell system.
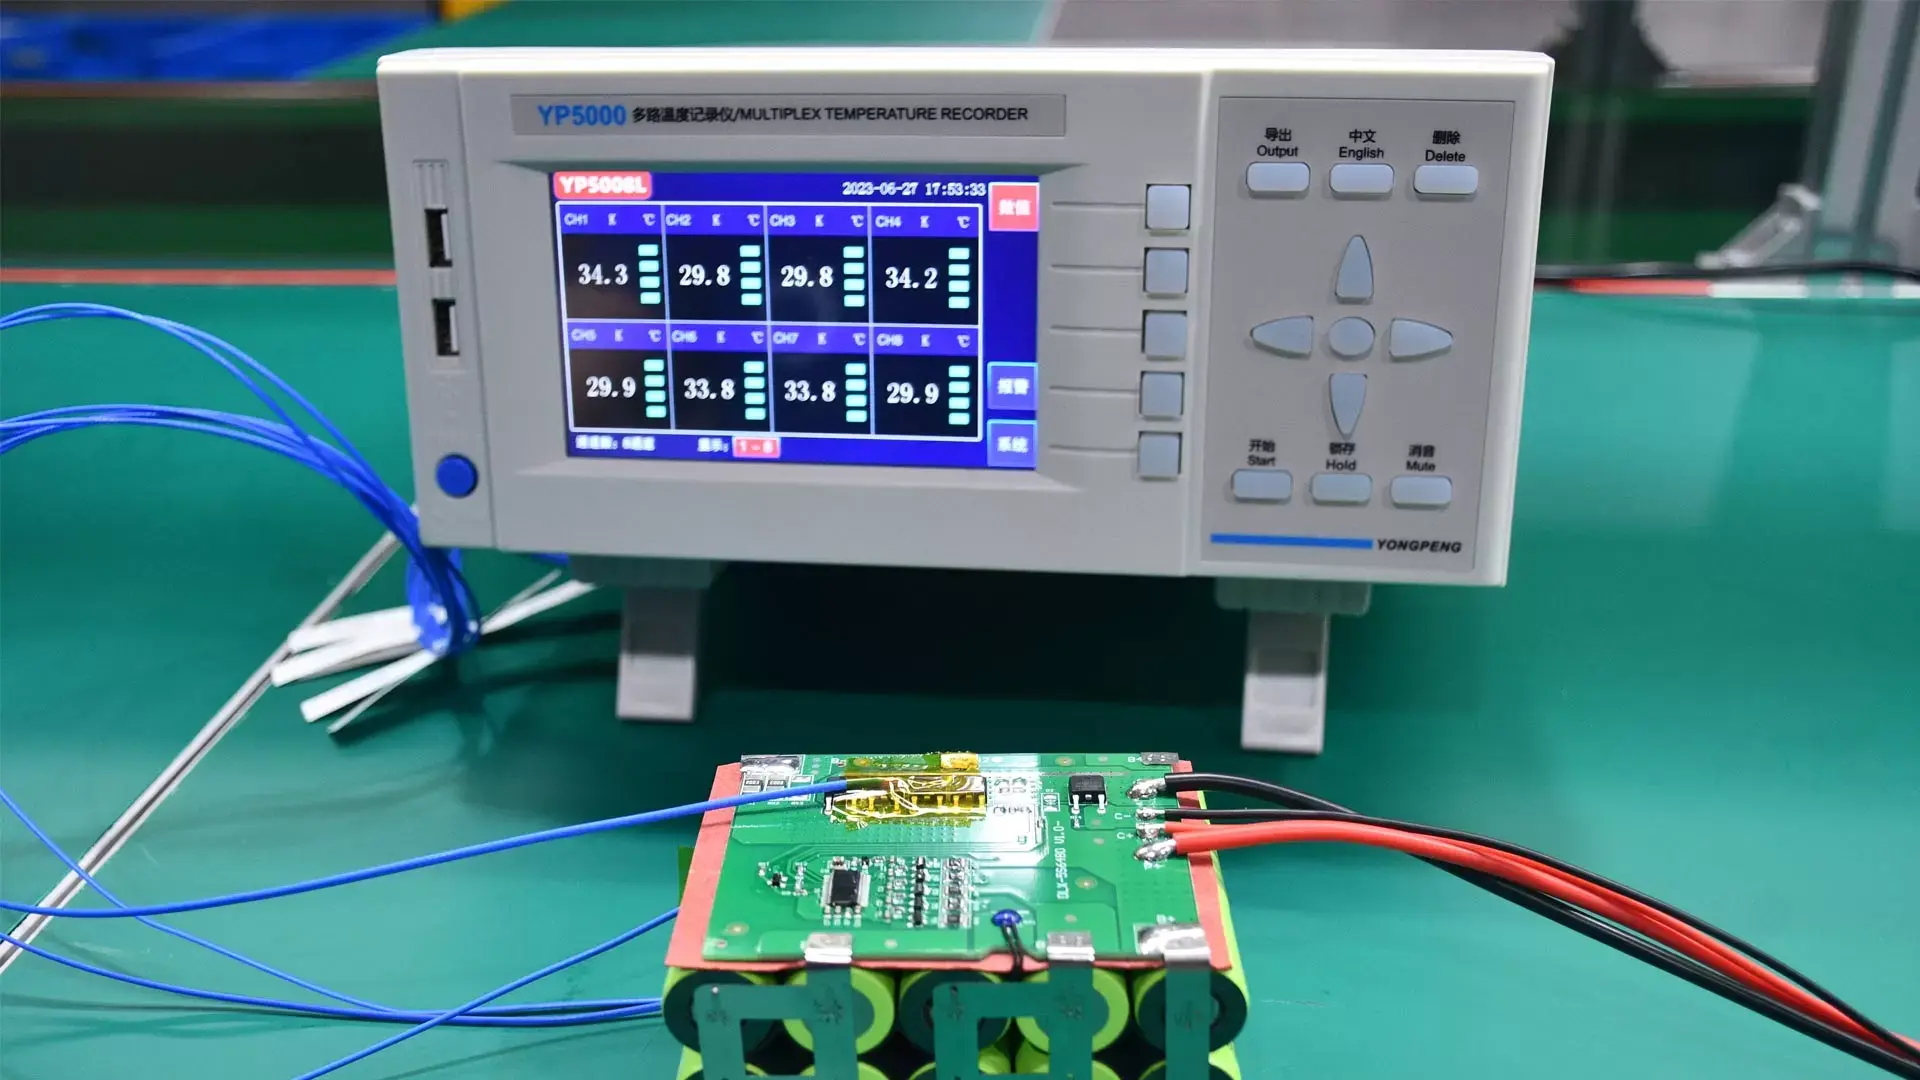
- Measurement precision requirements are demanding. Self-discharge work often deals with voltage changes on the order of tenths of a millivolt — a standard 4.5-digit voltmeter (1mV resolution) isn’t precise enough; this calls for 6.5-digit-class instrumentation (0.1mV resolution or better), combined with tight control of ambient test temperature, since even a 1°C swing can introduce a reading drift large enough to invalidate a measurement.
This is part of why we keep coming back to “don’t trust a self-discharge number with no stated test method” — not because that’s a particularly deep insight, but because doing this measurement properly is a genuine engineering system, and any weak link in it distorts the resulting figure.
Where Self-Discharge Sits in CM Batteries’ Reliability Test Framework
We don’t test self-discharge as an isolated number — it’s one fixed checkpoint inside a broader reliability validation framework built around four pillars: Safety Validation, Electrical Performance & Lifecycle Endurance, Environmental & Robustness Testing, and BMS & Functional Intelligence. Self-discharge and storage testing live inside the Performance & Lifecycle Endurance pillar, alongside capacity verification, internal resistance measurement, and cycle-life validation.
The method itself is fixed: self-discharge rate is measured as capacity loss after resting a fully charged cell (100% SoC) for 28 days, and it’s used specifically as a manufacturing-consistency indicator — which is exactly the diagnostic role this article has been building toward. A companion test, storage life testing, evaluates capacity recovery after longer-term storage under a defined SoC and temperature. What we don’t do is publish one universal pass/fail number that applies regardless of application — because we build custom packs, and an industrial IoT sensor sitting idle for months has a different tolerance for capacity loss than a backup power system cycled weekly. The test protocol is fixed; the acceptance threshold gets set per program, tied to the actual storage and duty-cycle profile.
That’s consistent with everything else in this article: we’re not putting out an unqualified “X% per month” headline, not because we don’t test for it, but because a number without the application context behind it isn’t something you could act on anyway. If you want to see where self-discharge and storage testing acceptance criteria land for your specific application, our engineering team can walk through it directly. The full framework is documented at CM Batteries’ Reliability Test Framework.
Red Flags When Evaluating a Supplier’s Self-Discharge Claims
Some of this echoes what engineers and hobbyists bring up in public forums when they’re worried about overstated or inconsistent cell specs. Before trusting a self-discharge number on a datasheet:
- No stated test conditions. A percentage with no temperature, SoC, or duration can’t be verified or reproduced.
- No stated test method. Ask whether the figure came from a full discharge test, OCV tracking, K-value screening, or EIS — each has different blind spots.
- “Industry-leading” language with nothing behind it. Ask for the underlying data instead of the adjective.
- No batch-level consistency data. One self-discharge figure says nothing about variance within a batch. Ask what method the supplier uses to catch outliers, and what the pass/fail threshold is.
- Loosely cited certifications. Confirm what’s actually held versus “supported” or “compliant.” For us, that’s UN38.3 (held, mandatory for transport) and ISO 9001 (factory-certified).
Storage Best Practices to Minimize Self-Discharge
- Store cooler where practical — the Arrhenius relationship above means even a modest temperature drop meaningfully slows self-discharge.
- Skip long-term storage at 100% SoC; a partial-charge state, commonly 40–60%, is generally safer.
- Use a pack with a well-designed BMS. Poor cell balancing or parasitic BMS current draw can look like self-discharge in field reports even when the cells themselves are fine.
FAQ
What Is a Good Self-Discharge Rate for a Lithium-Ion Battery?
There’s no single “good” number without context. A rate that’s fine for a consumer device replaced yearly might not be acceptable for industrial equipment sitting in a warehouse for six months. Ask for the figure at your actual storage temperature and SoC, not a headline number from ideal lab conditions.
Does Self-Discharge Rate Affect Long-Term Battery Lifespan?
Related, but not the same thing. High self-discharge often tracks the same side reactions (SEI breakdown, electrolyte decomposition) that drive long-term capacity fade, but a cell can have acceptable self-discharge and still degrade for other reasons — or the other way around.
Is High Self-Discharge a Sign of a Defective or Counterfeit Cell?
It can be. Abnormally high or inconsistent self-discharge within a batch is exactly what K-value or OCV screening is built to catch, and dimensional defects or contamination during manufacturing are a common root cause. Worth asking a supplier whether they run this kind of screen, where the threshold sits, and how they trace root cause when an abnormal batch shows up.
Is There a Difference Between Physical and Chemical Self-Discharge?
Yes, and engineers usually treat them as separate problems. Physical self-discharge comes from internal micro-shorts — metal contamination, separator defects, electrode burrs — and tends to trace back to batch or incoming-material quality. Chemical self-discharge comes from side reactions between electrode and electrolyte that consume active lithium, and is more a property of the material system itself. Common ways to tell them apart include comparing self-discharge at high vs. room temperature, comparing before and after cycling, and cryogenic leakage-current testing — covered above.
Does Sodium-ion Self-discharge Faster Than Lithium-ion?
Often, according to industry comparisons — but peer-reviewed calendar-aging work shows the gap narrows or shifts with SoC, and both chemistries lean on similar cathode-driven self-discharge mechanisms at high SoC. Any single-number comparison deserves the same skepticism you’d apply to a lithium-ion datasheet claim.
How Can I Estimate a Battery’s Self-Discharge Myself?
Fully charge the cell, measure OCV, let it rest disconnected for a known period at controlled temperature, then measure again. The OCV change — or a full discharge to check remaining capacity — gives you a rough number. For catching small leakage currents at production scale, K-value screening or EIS is far more precise.